Entity-Relationship (ER) Diagrams: A Visual Representation of Data Models
Learn how to create and interpret Entity-Relationship (ER) diagrams, a visual tool for representing data models. Understand the components of ER diagrams, including entities, attributes, relationships, and cardinality constraints, and how they help in designing databases and understanding data relationships.
DBMS - ER Diagram Representation
An Entity-Relationship (ER) model can be visually represented through an ER diagram. This diagram illustrates various objects such as entities, entity attributes, relationship sets, and relationship set attributes.
Entity
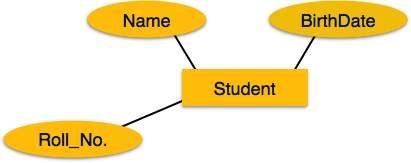
Entities are depicted by rectangles in an ER diagram. Each rectangle is labeled with the name of the entity set it represents.

Attributes
Attributes are the properties of entities and are represented by ellipses. Each ellipse signifies one attribute, which is directly connected to its corresponding entity (rectangle).
Types of Attributes
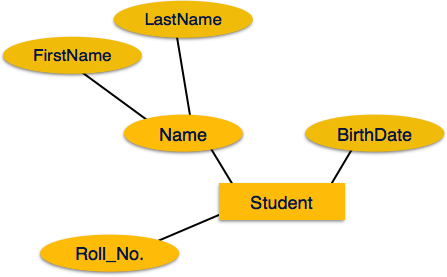
- Simple Attributes − These are represented by a single ellipse. If the attribute is composite, it is further divided in a tree-like structure, with each sub-attribute connected by an ellipse.
- Composite Attributes − Composite attributes are represented by ellipses connected in a hierarchical structure to show sub-attributes.
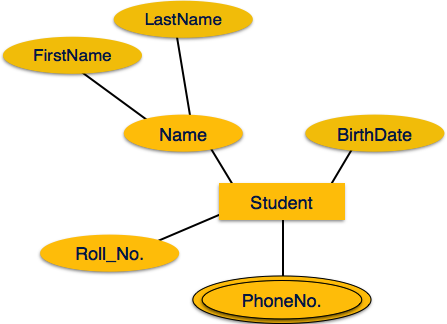
- Multivalued Attributes − These are depicted by a double ellipse, indicating that the attribute can have multiple values.
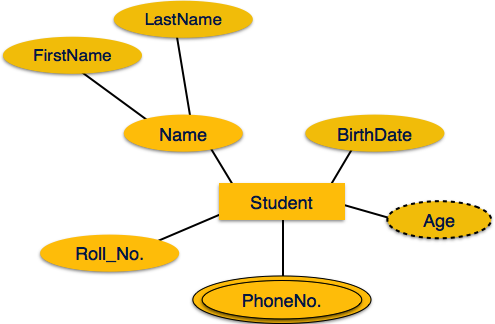
- Derived Attributes − These are represented by a dashed ellipse to show that the attribute value is derived from other attributes.


Relationship
Relationships are illustrated using diamond-shaped boxes with the relationship name inside. Lines connect the diamond shape to the participating entities (rectangles).
Binary Relationship and Cardinality
A relationship between two entities is called a binary relationship. Cardinality specifies the number of instances of an entity that can participate in a relationship. The types include:
- One-to-One (1:1) − Each instance of one entity is associated with only one instance of the other entity. This is depicted as '1:1' in the diagram.
- One-to-Many (1:N) − One instance of an entity on the left is related to multiple instances of another entity on the right, depicted as '1:N'.
- Many-to-One (N:1) − Multiple instances of an entity on the left are associated with only one instance of another entity on the right, shown as 'N:1'.
- Many-to-Many (N:M) − Multiple instances of both entities are related to each other, represented as 'N:M'.


Participation Constraints
- Total Participation − This indicates that each entity is involved in the relationship, and is represented by double lines.
- Partial Participation − Not all entities are required to participate in the relationship, indicated by single lines.
